How to use NeuroMMSig
Data submission
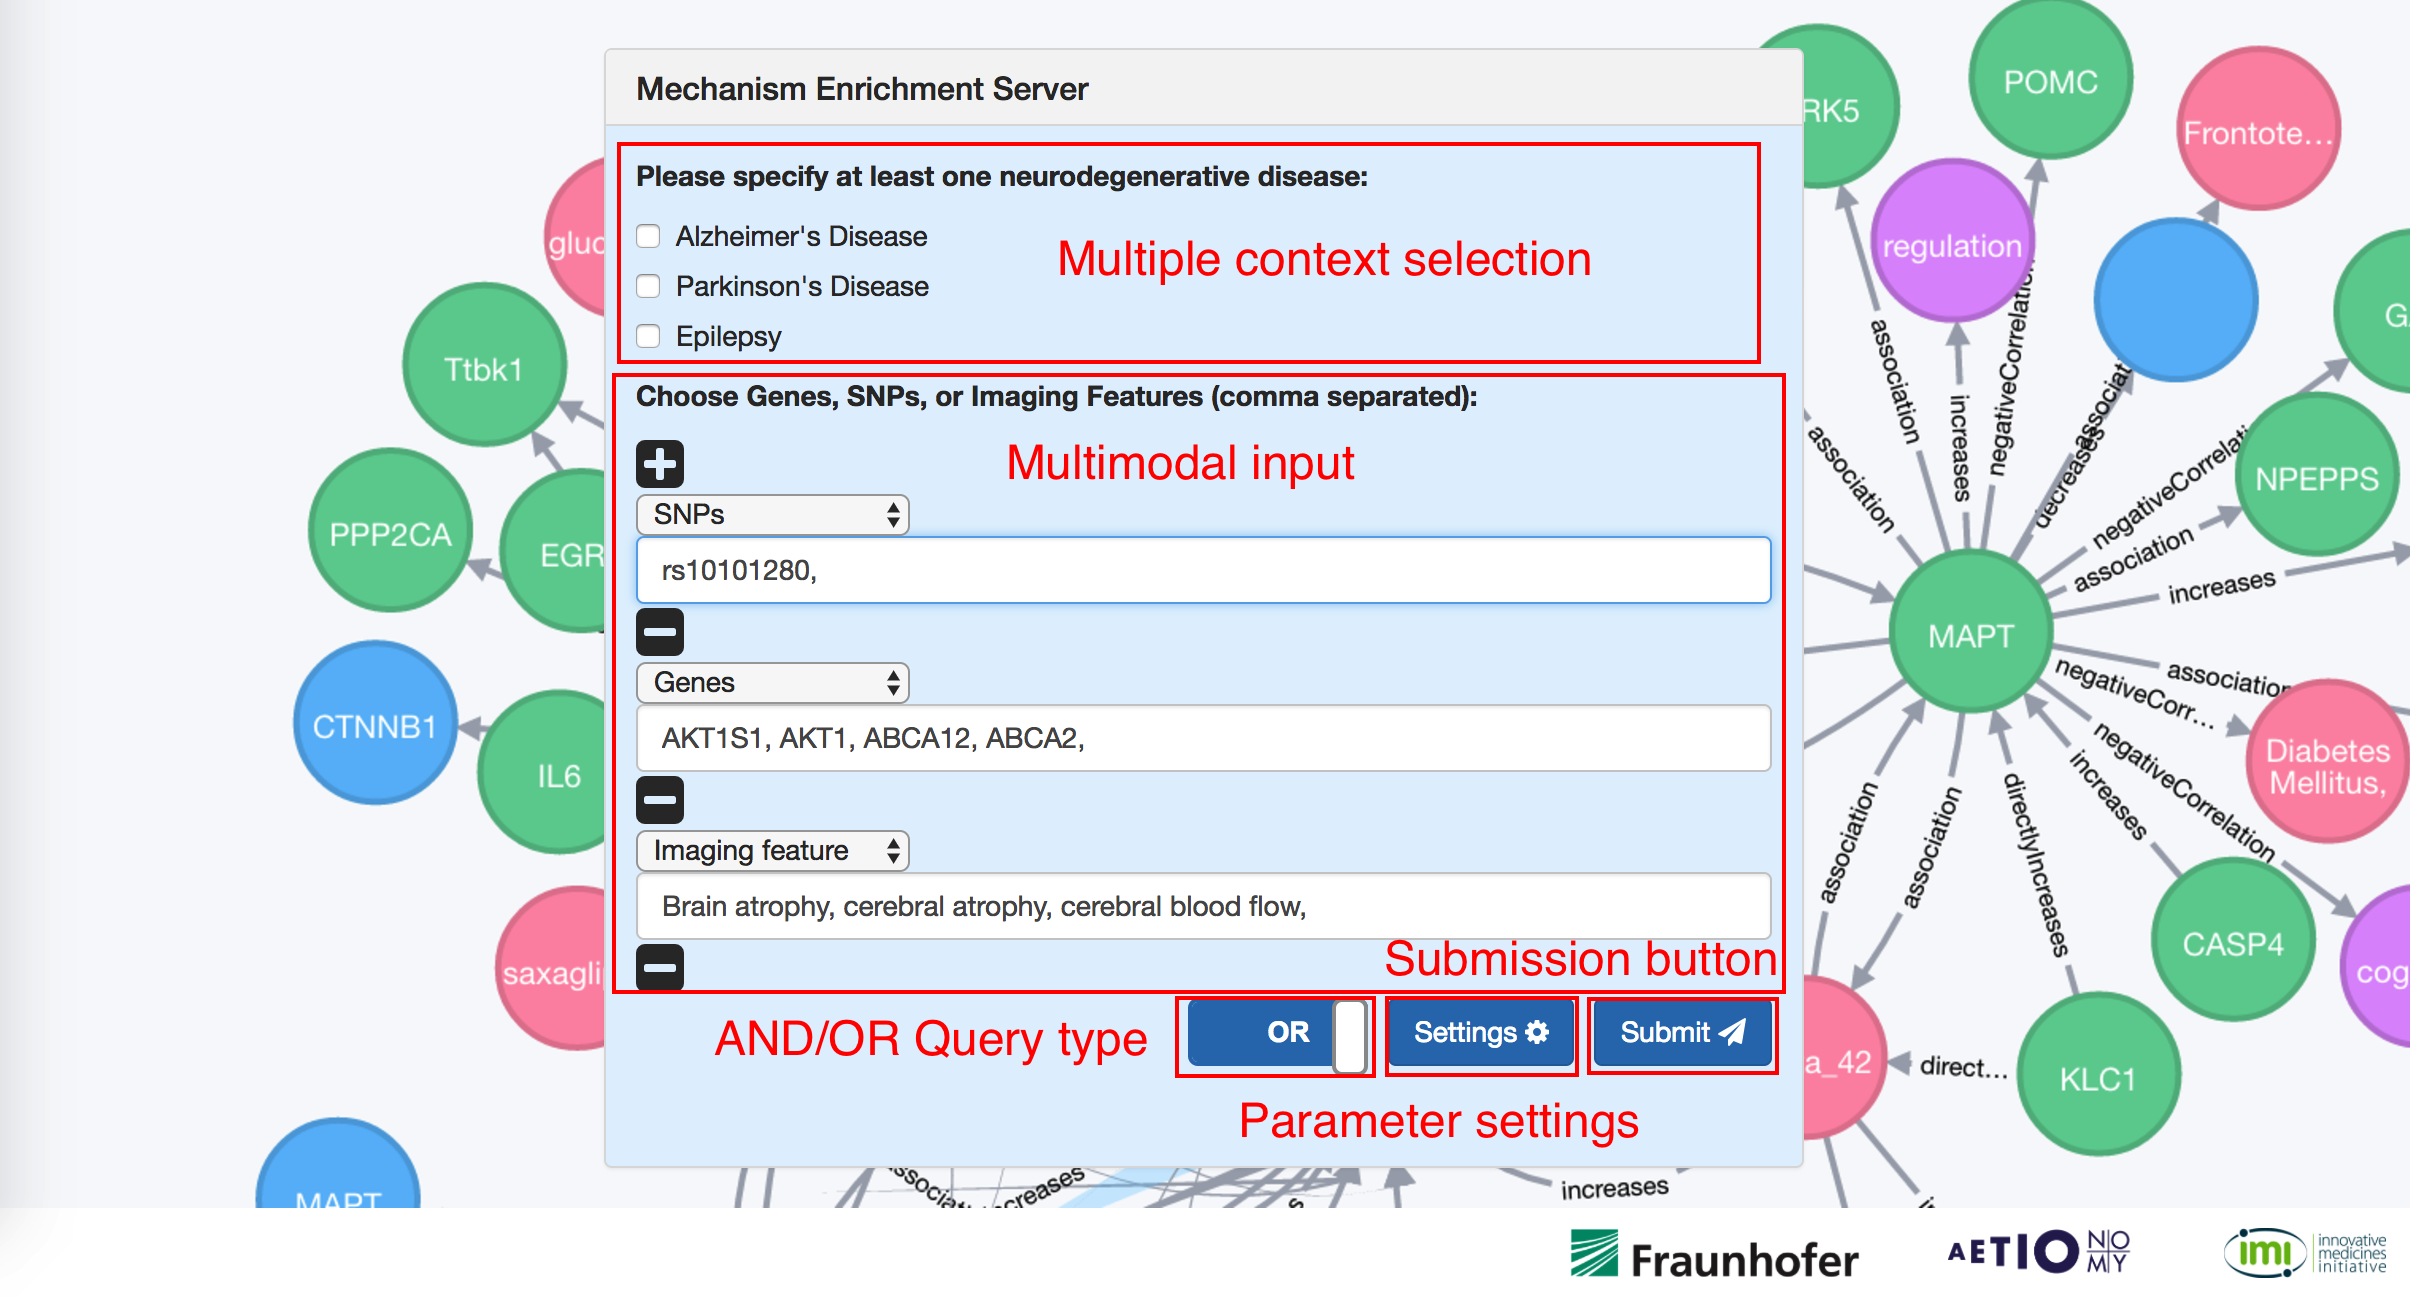
The image below shows the first impression that you get from NeuroMMSig. In the navigation bar clicking in "Quick View" , one can get access the "Introduction" and "How to use" sections plus database login for developers. Below, the NeuroMMSig form where one should select at least one disease context and introduce the data. Select multiple disease allows you to compare subgraphs between them. Thus, one can compare subgraphs from Alzheimer's and Parkinson's disease. Multiple data types can be sent by clicking in the "+" button and adding multiple inputs to the form.
The "settings" button enables you to optimize the algorithm parameters. By default all variables are set to 1. In order to submit data you have to press the enter button or click on the submission button. The last button enables you to change the context of the query using the "OR" and "AND" options. The "OR" options can be used to retrieve the union of all subgraphs in the query and the "AND" to retrieve the intersection of all subgraphs in the query (only the subgraphs that match all data will be returned, similarly to a MySQL query).
In the table below, all types of data accepted by NeuroMMSig together with their format are listed. Once data have been introduced, please press ENTER or click the "Submit" button
| Data type | Format | Example |
|---|---|---|
| Gene | HGNC Symbols comma separated. HGNC is responsible for approving unique symbols and names for human loci, including protein coding genes, RNA genes and pseudogenes, to allow unambiguous scientific communication. | ABAT,CASP7,IL1B,MEFV |
| SNP | rSNP ID number, or “rs” ID comma separated. This is an identification tag assigned by NCBI to a group (or cluster) of SNPs that map to an identical location. | rs11139084,rs1217338,rs2781542,rs7866199 |
| Imaging feature | Imaging features included in NeuroImage Feature Terminology (NIFT)1. | CSF levels, white matter volume, frontal lobe volume, hyperintensity |
Enriched subgraphs and multimodal linked data
Below, the results page where multiple subgraphs can be selected, see the enrichment scores, import results and have access to all cross scaled data (co-expressed genes, drugs, miRNA or related clinical trials). Information can be exported by clicking in "Download Excel" button located at the bottom of the page. In order to access the networks, simply click in "Visualize Network". In the top-right of the page, an info icon contains the legend of result page.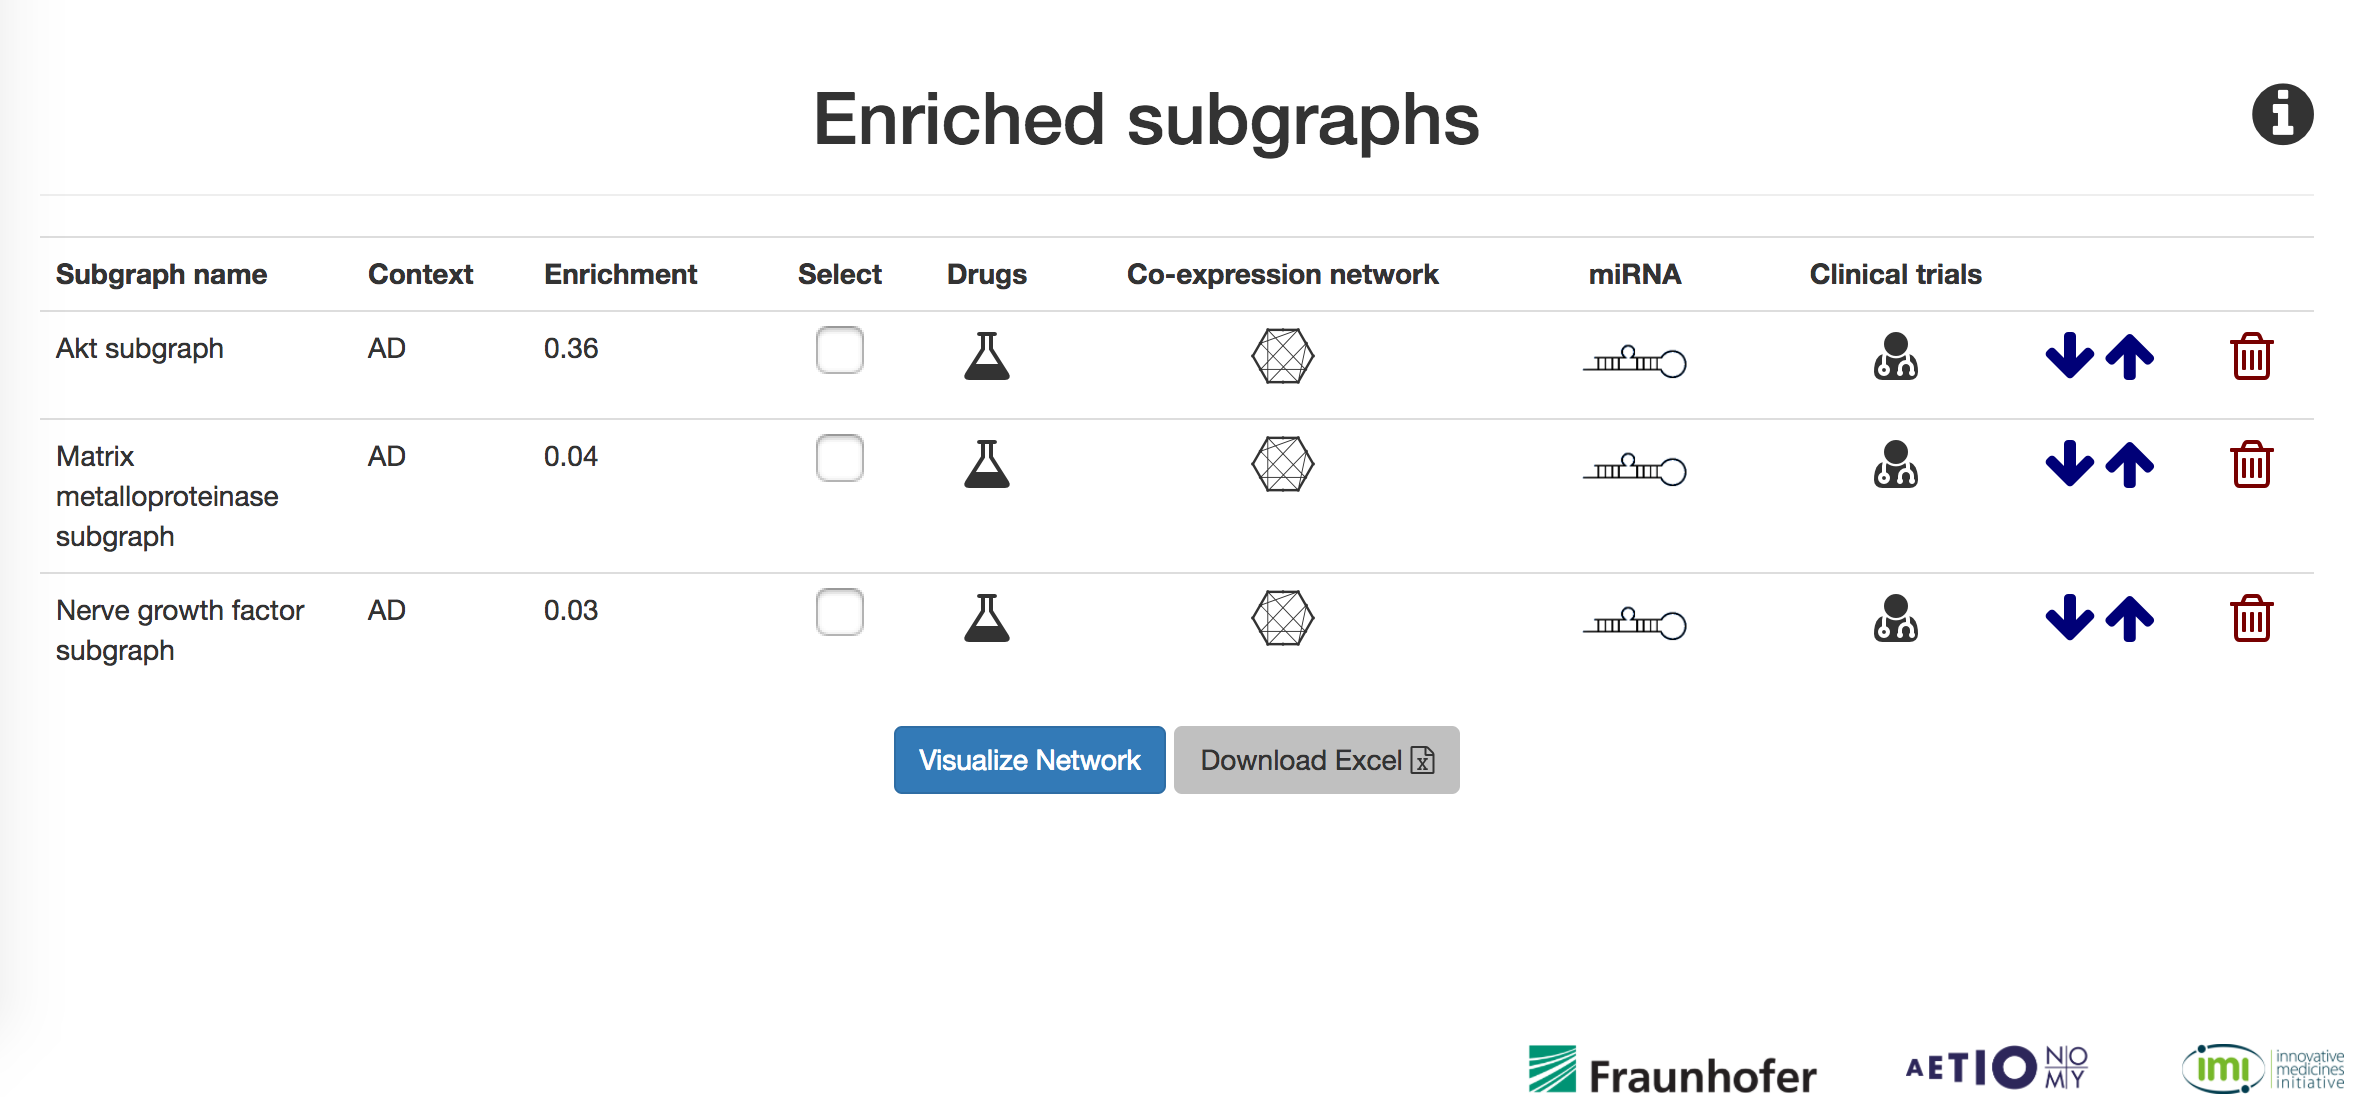
Network visualization and functionalities
Once in the network visualization, exporting options (BEL, image, json) are available as well as search funcionalities for edges and nodes. By clicking in "functionalities" you can visualize and find specific paths and exported to BEL. It is also possible interact with the subgraph by expanding the knowledge around nodes or deleting the nodes from the graph.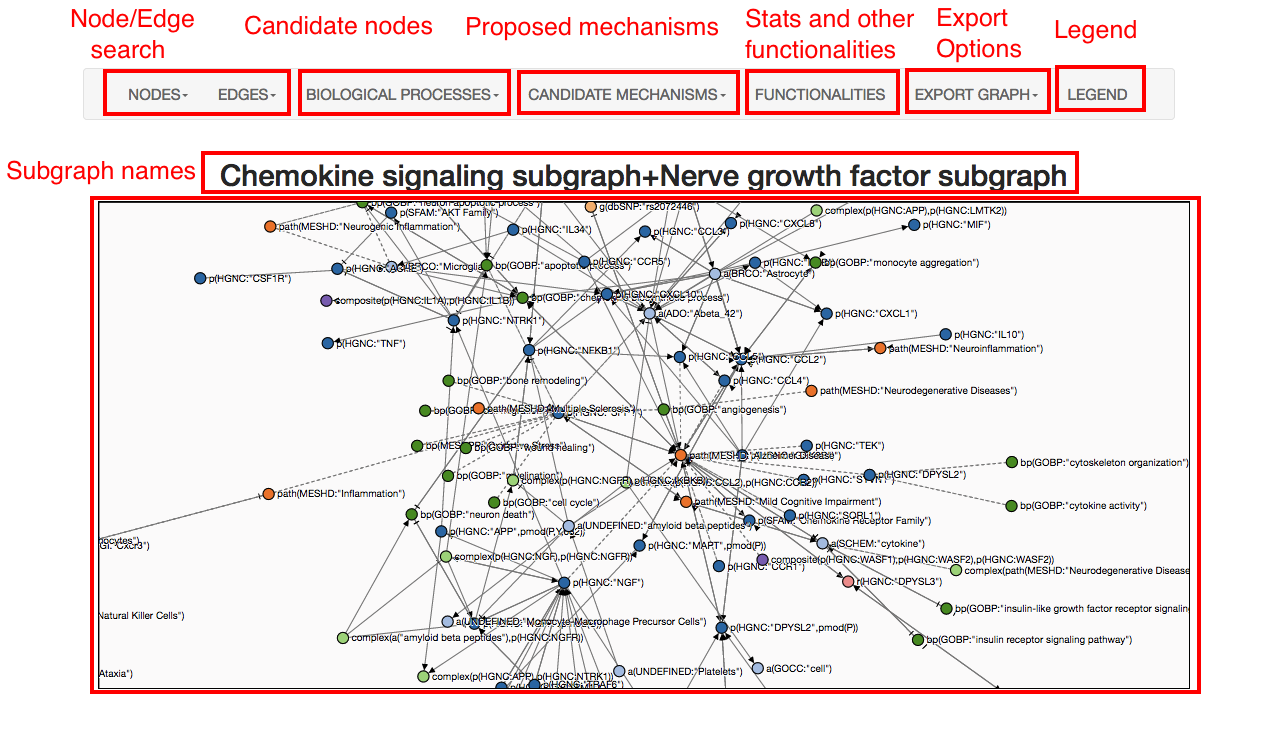
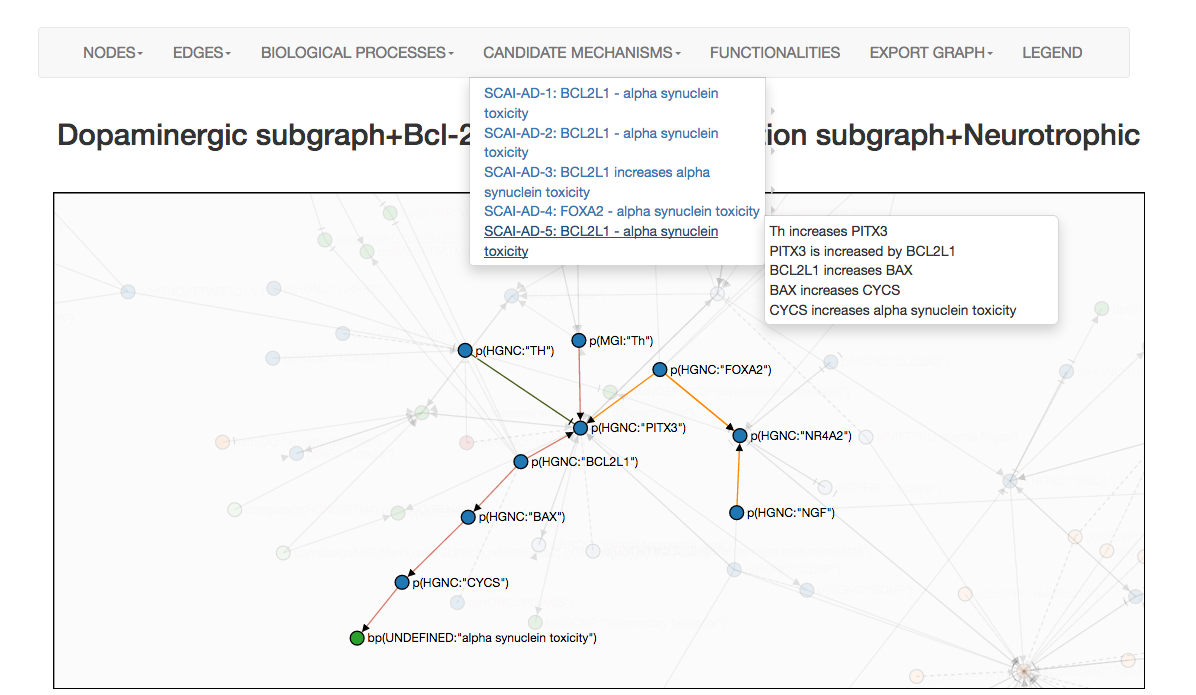
Candidate mechanism retrieval
Users should select candidate nodes based on their interest. From all data-mapped nodes to this selected node, candidate mechanisms (represented as a chain of causation or paths) are displayed in the "Candidate mechanism" tab. Clicking in each candidate mechanism, allows you to navigate and visualize it in the interface. An example of how candidate mechanism are displayed is shown below. This simple example has been generated by submitting a geneset of interest in the IMI project AETIONOMY: FOXA2, TH, BCL2L1, NGF in the context of Parkinson's. Later, all suggested subgraphs were selected. In the visualization site, "alpha synuclein toxicity" was selected as a biological process of interest in the disease. All paths from each of the nodes in the network which map the data-mapped nodes to the interesting node "alpha synuclein toxicity" are displayed in different colors (screenshot below). Here, PITX3 is suggested to be the key player in this particular mechanism.